Hot CPI and PPI Ignite Bond Sell-Off, But AI Hyperscaler Concerns Spark Flight to Safety Rally Cautiously Floating
September CPI came in fiery hot at 0.6% headline (3.7% YoY, up from 3.4%) and core 2.6% YoY, with PPI even hotter at 1.3% headline. Bonds got pummeled, but a flight to safety from AI hyperscaler debt concerns (CoreWeave, Nebius) and contrarian indicators fueled a remarkable midweek rally. The 10-year dropped from 5.31 back toward 5.04, and MBS rebounded off the 100.22 floor. Japan and China confirmed selling U.S. Treasuries. We are cautiously floating as volatility remains elevated.
30-Year Fixed
6.875%
15-Year Fixed
6.625%
30-Year FHA
6.75%

Where We Are Now
The week was a rollercoaster. Monday opened with yields improving as higher yields attracted buyers, MBS up 11 bps challenging the 100.70 ceiling, and the 10-year down to 5.21-5.22. Existing home sales for September came in at +1.5% MoM to ~4M annualized, but August and September were the two lowest sales paces of the year, and YoY sales are down ~2%. Median home price fell 2.4% to ~$418K (driven by mix of sales, more lower-priced homes in the South), though still up 1.3% YoY. Inventory rose to 1.6M units (+2% MoM, +5% YoY), with month supply at 4.8 months (above normal 4.6). Days on market increased from 31 to 33. First-time buyers held at ~31%, while investors (20%) and cash buyers (27%) saw slight upticks. The University of Michigan consumer sentiment index for October dropped from 48 to 46, the second lowest reading on record, with less than 50% of households expecting their incomes to rise over the next 12 months. The Atlanta Fed wage tracker showed YoY wages decelerating from 4.1% to 3.9%. ADP data showed ~25K jobs/week for the four weeks ending September 26 (~100K/month extrapolated), rising for six consecutive weeks. Cleveland Fed President Hammack (a hawk) signaled she favors a small October hike, while Fed futures priced a pause in October and a December hike. Then Wednesday's CPI was a gut punch: headline +0.6% (3.7% YoY, up from 3.4%, 1/10 hotter than expected), and core +0.3% (2.6% YoY, up from 2.4% which was barely rounded down last month). Gasoline rose over 9%. Shelter was not well behaved (up ~0.4%, OER up 0.3%, lodging away from home +2%+), and the core ex-shelter reading of 0.17 showed broad-based inflation. MBS got pummeled 60 bps, and the 10-year surged from 5.19 to 5.31, battling the critical 5.29 ceiling. Thursday's PPI was even hotter: headline +1.3% (double estimates), core +0.7% (vs 0.3% expected), with YoY headline at 6.3% and core at 5.0%. Retail sales came in at +0.8% (double expectations) but the core was only +0.1%, indicating the headline was driven by gas spending, not discretionary spending. However, a flight to safety from AI hyperscaler debt concerns (CoreWeave, Nebius) sparked a remarkable rally. MBS surged 35-41 bps, and the 10-year dropped 14 bps toward 5.04. The Economist's 'Will bonds blow up?' cover served as a contrarian indicator, as did stories about the 10-year going over 6%. By Friday, Fed Chair Warsh kept his cards close, dropping October hike odds to ~15%. The Move Index surged above 102, signaling elevated volatility. The MBS-Treasury spread widened from ~2% to ~2.25% due to prepayment risk. TIC data confirmed Japan sold $36B and China sold $27B of U.S. Treasuries in August. Goldman Sachs reiterated a buy on CoreWeave, putting some selling pressure back into bonds. The 10-year is now testing the 5% level, and MBS is battling the 25-day moving average but unable to sustain breakouts.
New Home Sales
Existing home sales data for September from NAR. Median price decline driven by mix of sales (more lower-priced homes in the South). Month supply above normal market of 4.6 months.
Inflation & Oil Pressure
CPI data for September from BLS. Core CPI rounded up from 2.446% last month. PPI data for September from BLS. Consumer sentiment from University of Michigan. Wage data from Atlanta Fed.
30-Year Fixed
6.875%
15-Year Fixed
6.625%
10-Year Treasury
~5.04%
Inventory
4.8 months
MBS Technical Update, Week of October 19, 2026
The week opened with yields improving as higher yields attracted buyers, but Wednesday's CPI report was a gut punch: headline inflation came in at a fiery 0.6% (3.7% YoY, up from 3.4%), and core CPI rose to 2.6% YoY. MBS got pummeled, down 60 bps, and the 10-year surged from 5.19 to 5.31, battling the critical 5.29 ceiling. Thursday's PPI was even hotter at 1.3% headline (double estimates), but a flight to safety from AI hyperscaler debt concerns (CoreWeave, Nebius) sparked a remarkable rally. MBS surged 35-41 bps, and the 10-year dropped 14 bps toward 5.04. The Economist's "Will bonds blow up?" cover served as a contrarian indicator. By Friday, Fed Chair Warsh kept his cards close, dropping October hike odds to ~15%. The Move Index surged above 102, signaling elevated volatility. TIC data confirmed Japan sold $36B and China sold $27B of Treasuries in August. The 10-year is now testing the 5% level, and MBS is battling the 25-day moving average. We are cautiously floating.
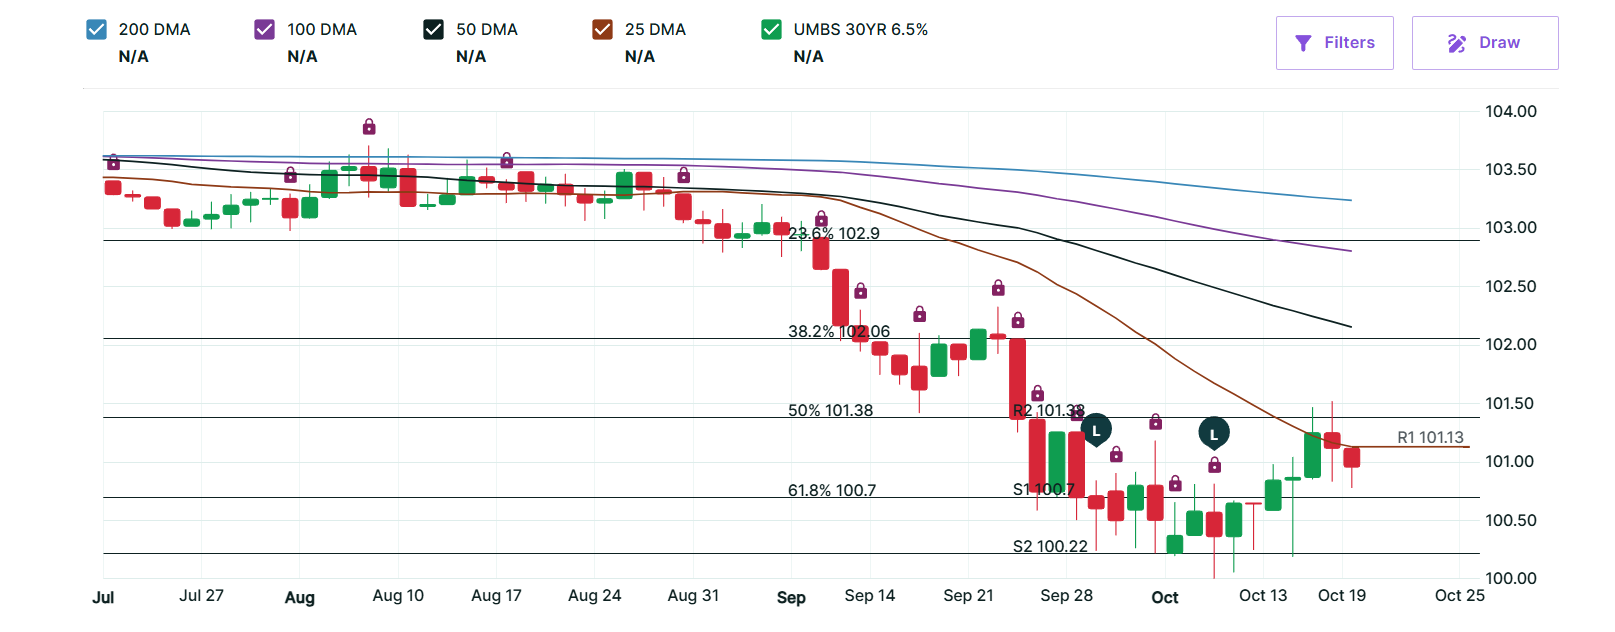
MBS Floor
100.22
Held firm throughout the week. Bounced off it after Wednesday's CPI sell-off. Stochastics showing positive crossover. Next support at 99.86 (Fibonacci level) if it breaks
MBS Resistance
100.70
25-day moving average and 50% Fibonacci level. Multiple breakout attempts but unable to sustain. Key ceiling to watch for continued improvement
10-Yr Treasury
~5.04%
Dropped from 5.31 after flight to safety rally. Broke under the 25-day MA and the 5.18 level. Testing the 5% psychological level. 5.29 remains key ceiling above
Oil (WTI)
~$97/bbl
Up from $92 on escalating Middle East tensions. U.S. drafting strike plans against Iran, Iran making inflammatory statements. Elevated and a headwind for bonds
What Improved
- • MBS surged 35-41 bps on flight to safety rally (Wed-Thu)
- • 10-year dropped 14 bps toward 5.04, testing the 5% level
- • Flight to safety from AI hyperscaler debt concerns (CoreWeave, Nebius)
- • 5.29 ceiling held on the 10-year after being tested post-CPI
- • MBS 100.22 floor held firm after CPI sell-off, bounced off it
- • Stochastics showing positive crossover, momentum on our side
- • 10-year broke under the 25-day moving average
- • 10-year broke under the 5.18 level, challenging 5.04
- • Contrarian indicator: Economist "Will bonds blow up?" cover
- • Stories about 10-year over 6% = crowded trade, possible top
- • Fed Chair Warsh kept cards close, October hike odds dropped to ~15%
- • Fed futures pricing a pause in October
- • Existing home sales: +1.5% MoM to ~4M annualized pace
- • Median home price YoY: still up 1.3% despite MoM decline
- • First-time buyers stable at ~31%
- • Atlanta Fed wage tracker: YoY wages decelerated from 4.1% to 3.9%
- • ADP: ~25K jobs/week, rising for 6 consecutive weeks
- • Single-family rents (Aug): +2% YoY (up from 1.8%)
- • MBS challenging the 25-day MA and 50% Fibonacci level
What to Watch
Next week is light on news. Tuesday: housing starts and permits. Wednesday: pending home sales. Technicals, stock market movements, and AI hyperscaler headlines will drive trading. Watch the 5.04 level on the 10-year and the 25-day MA on MBS.
- • CPI headline: +0.6% MoM, 3.7% YoY (up from 3.4%) - fiery hot
- • Core CPI: 2.6% YoY (up from 2.4%) - broad-based inflation
- • CPI shelter: +0.4%, lodging away from home +2%+ (wild card)
- • PPI headline: +1.3% MoM (double estimates), 6.3% YoY
- • PPI core: +0.7% MoM (vs 0.3% expected), 5.0% YoY
- • Retail sales: +0.8% headline but core only +0.1% (gas spending)
- • UMich consumer sentiment (Oct): dropped from 48 to 46
- • Second lowest sentiment reading on record
- • Less than 50% of households expect income rise in next 12 months
- • Move Index above 102 (elevated volatility, whipsaw risk)
- • MBS-Treasury spread widened from ~2% to ~2.25% (prepayment risk)
- • Japan sold $36B Treasuries in August (TIC data confirmed)
- • China sold $27B Treasuries in August (TIC data confirmed)
- • AI hyperscaler debt: ~$400B/year corporate grade competing with Treasuries
- • Revenue required for AI debt: $8.5T vs forecast $3.6T
- • Gartner: 80% of neo cloud companies won't survive through 2030
- • Cleveland Fed's Hammack (hawk): favors October hike
- • Fed futures pricing December hike after hot CPI
- • Oil up to ~$97 on U.S.-Iran tensions and strike plan drafting
- • Existing home sales: Aug and Sep were two lowest paces of the year
- • Median home price fell 2.4% MoM to ~$418K (mix of sales)
- • Days on market increased from 31 to 33
- • MBA: purchases down 16% YoY, refis down 56% YoY
- • ARM share at 10.5% (highest in a year)
- • MBS unable to sustain breakouts above 25-day MA
- • If 10-year closes above 5.29, next stop is 5.43 (2002 highs)
Current Stance: CAUTIOUSLY FLOATING - 10-YEAR TESTING 5.04, MBS BATTLING 25-DAY MA, FLIGHT TO SAFETY RALLY, MOVE INDEX ELEVATED AT 102+The week was a wild ride. Wednesday's CPI was fiery hot (0.6% headline, 3.7% YoY, core 2.6%), and Thursday's PPI was even hotter (1.3% headline, double estimates). MBS got pummeled 60 bps and the 10-year surged to 5.31. But a flight to safety from AI hyperscaler debt concerns (CoreWeave, Nebius) sparked a remarkable rally, with MBS surging 35-41 bps and the 10-year dropping toward 5.04. The Economist's "Will bonds blow up?" cover served as a contrarian indicator. Fed Chair Warsh kept his cards close, dropping October hike odds to ~15%. The Move Index surged above 102, signaling elevated volatility. TIC data confirmed Japan and China sold U.S. Treasuries in August. The 10-year is now testing the 5% level, and MBS is battling the 25-day moving average but unable to sustain breakouts. Next week is light on news (housing starts/permits Tuesday, pending home sales Wednesday), so technicals and stock market movements will drive trading. We are cautiously floating, watching whether the 10-year holds under 5.29 and MBS can break above the 25-day MA.
The Trend: One Thing Leads to Another
The week was a technical rollercoaster. Monday opened with MBS up 11 bps, challenging the 100.70 ceiling, and the 10-year at 5.21-5.22. Wednesday's hot CPI (0.6% headline, 3.7% YoY, core 2.6%) pummeled MBS 60 bps and pushed the 10-year to 5.31, testing the 5.29 ceiling. Thursday's even hotter PPI (1.3% headline, double estimates) would normally be terrible for bonds, but a flight to safety from AI hyperscaler debt concerns (CoreWeave, Nebius) sparked a remarkable rally. MBS surged 35-41 bps, and the 10-year dropped 14 bps toward 5.04. The Economist's 'Will bonds blow up?' cover served as a contrarian indicator, as did stories about the 10-year going over 6%. After testing the 100.22 floor on the CPI sell-off, MBS rebounded and is now challenging the 25-day moving average and the 50% Fibonacci level. Stochastics show a positive crossover being confirmed, indicating momentum is on our side. The 10-year broke under the 5.18 level and the 25-day moving average, and is now challenging 5.04 - never thought we'd be happy to see 10-year yields getting back closer to 5%. By Friday, Fed Chair Warsh kept his cards close, dropping October hike odds to ~15%. The Move Index surged above 102, signaling elevated volatility. The MBS-Treasury spread widened from ~2% to ~2.25% due to prepayment risk from elevated volatility. TIC data confirmed Japan sold $36B and China sold $27B of U.S. Treasuries in August. Goldman Sachs reiterated a buy on CoreWeave on Monday, putting some selling pressure back into bonds. The 10-year is beneath the 25-day moving average, above the 5.04 level, roughly around the 5% level. MBS is having a tough time getting above the 25-day MA - made a couple of breakouts but unable to sustain them.
"The cure for higher yields is higher yields. You add to that this flight to safety, and we are seeing a lot of concerns out there in the AI space. If everybody's on one side of the trade, where's the money going to come from to keep that side of the trade going?"
Key Market Dynamics
Hot CPI Report
September CPI came in fiery hot: headline +0.6% MoM (3.7% YoY, up from 3.4%), and core +0.3% (2.6% YoY, up from 2.4% which was barely rounded down last month). Gasoline rose over 9%. Shelter was not well behaved (up ~0.4%, OER up 0.3%, lodging away from home +2%+). Core ex-shelter was 0.17, showing broad-based inflation. This changed the narrative for the Fed, pushing October 28 hike odds from under 20% to above 50%.
Even Hotter PPI
Thursday's PPI was even hotter than CPI: headline +1.3% MoM (double estimates), core +0.7% (vs 0.3% expected). YoY headline at 6.3% and core at 5.0%. While producer inflation doesn't always translate to consumer inflation (wholesalers can eat margins), these were ugly numbers that would normally be terrible for bonds.
Flight to Safety Rally
Despite the hot inflation data, a flight to safety from AI hyperscaler debt concerns (CoreWeave, Nebius) sparked a remarkable rally. CoreWeave's business model of borrowing money to buy GPUs and build data centers raised red flags about repayment ability. Gartner said 80% of neo cloud companies won't survive through 2030. Revenue required is $8.5T vs forecast of only $3.6T. This caused a sell-off in AI equities and bonds, with capital flowing into safer U.S. Treasuries.
Contrarian Indicators
The Economist's 'Will bonds blow up?' cover and widespread stories about the 10-year going over 6% served as contrarian indicators. The philosophy: if everybody's on one side of the trade, where's the money going to come from to keep it going? Historical examples include Joe Kennedy's shoe shine boy in 1929 and Wall Street Journal's 'How low can stocks go?' in 2009 at the market bottom.
Move Index and Volatility
The Move Index surged above 90, currently around 102-103, signaling elevated volatility. This has caused the MBS-Treasury spread to widen from ~2% to ~2.25%, as elevated volatility increases prepayment risk (yields could drop suddenly, causing refinancing), which reduces servicing value and worsens mortgage bond pricing. Whipsaw risk is high.
Treasury Selling and AI Debt
TIC data confirmed Japan sold $36B and China sold $27B of U.S. Treasuries in August, adding significant selling pressure. Additionally, AI hyperscaler companies are issuing ~$400B/year of corporate grade debt that competes with Treasuries. With the U.S. government already pumping out $2T in debt, adding another $400B creates significant yield pressure as the market must absorb it all.
Where We're Going
Next week is light on the news front, so technicals, stock market movements, and AI hyperscaler headlines will dominate trading. Tuesday brings housing starts and permits, and Wednesday brings pending home sales. The key technical levels to watch: the 10-year Treasury is testing the 5% psychological level (5.04). If it holds here, there is room for continued improvement. If it moves back above 5.29, the next stop is 5.43 (2002 highs), which would be ugly. For MBS, the 100.22 floor has held firm, and the market is battling the 25-day moving average and 50% Fibonacci level at 100.70. A sustained break above the 25-day MA would open room toward 101.38. The flight to safety rally from AI hyperscaler concerns could continue if those stocks remain under pressure, but Goldman Sachs' buy rating on CoreWeave could reverse the flow. The Move Index is elevated at 102+, so whipsaw risk is high and price fluctuations could be large. Fed Chair Warsh's comments dropped October hike odds to ~15%, but December is still in play depending on the data. Geopolitical risks (U.S.-Iran, Middle East) remain ever-present, with oil at ~$97/barrel and the U.S. drafting strike plans. Japan and China's Treasury selling is confirmed and could continue. Watch the correlation between AI hyperscaler stocks and bond movements for directional hints.
Positive Catalysts
- MBS surged 35-41 bps on flight to safety rally (Wed-Thu)
- 10-year dropped 14 bps toward 5.04, testing the 5% level
- Flight to safety from AI hyperscaler debt concerns (CoreWeave, Nebius)
- 5.29 ceiling held on the 10-year after being tested post-CPI
- MBS 100.22 floor held firm after CPI sell-off, bounced off it
- Stochastics showing positive crossover, momentum on our side
- 10-year broke under the 25-day moving average
- 10-year broke under the 5.18 level, challenging 5.04
- Contrarian indicator: Economist 'Will bonds blow up?' cover
- Stories about 10-year over 6% indicate crowded trade, possible top
- Fed Chair Warsh kept cards close, October hike odds dropped to ~15%
- Fed futures pricing a pause in October
- Existing home sales: +1.5% MoM to ~4M annualized pace
- Median home price YoY: still up 1.3% despite MoM decline
- First-time buyers stable at ~31%
- Atlanta Fed wage tracker: YoY wages decelerated from 4.1% to 3.9%
- ADP: ~25K jobs/week, rising for 6 consecutive weeks
- Single-family rents (Aug): +2% YoY (up from 1.8%)
- MBS challenging the 25-day MA and 50% Fibonacci level
Risk Factors
- CPI headline: +0.6% MoM, 3.7% YoY (up from 3.4%) - fiery hot
- Core CPI: 2.6% YoY (up from 2.4%) - broad-based inflation
- CPI shelter: +0.4%, lodging away from home +2%+ (wild card)
- PPI headline: +1.3% MoM (double estimates), 6.3% YoY
- PPI core: +0.7% MoM (vs 0.3% expected), 5.0% YoY
- Retail sales: +0.8% headline but core only +0.1% (gas spending)
- UMich consumer sentiment (Oct): dropped from 48 to 46
- Second lowest sentiment reading on record
- Less than 50% of households expect income rise in next 12 months
- Move Index above 102 (elevated volatility, whipsaw risk)
- MBS-Treasury spread widened from ~2% to ~2.25% (prepayment risk)
- Japan sold $36B Treasuries in August (TIC data confirmed)
- China sold $27B Treasuries in August (TIC data confirmed)
- AI hyperscaler debt: ~$400B/year corporate grade competing with Treasuries
- Revenue required for AI debt: $8.5T vs forecast $3.6T
- Gartner: 80% of neo cloud companies won't survive through 2030
- Cleveland Fed's Hammack (hawk): favors October hike
- Fed futures pricing December hike after hot CPI
- Oil up to ~$97 on U.S.-Iran tensions and strike plan drafting
- Existing home sales: Aug and Sep were two lowest paces of the year
- Median home price fell 2.4% MoM to ~$418K (mix of sales)
- Days on market increased from 31 to 33
- MBA: purchases down 16% YoY, refis down 56% YoY
- ARM share at 10.5% (highest in a year)
- MBS unable to sustain breakouts above 25-day MA
- If 10-year closes above 5.29, next stop is 5.43 (2002 highs)
Current Stance
CAUTIOUSLY FLOATING - 10-YEAR TESTING 5.04, MBS BATTLING 25-DAY MA, FLIGHT TO SAFETY RALLY, MOVE INDEX ELEVATED AT 102+
Today's Rates
As of October 19, 2026, subject to change without notice
Rates are for informational purposes only and subject to change without notice. APR includes fees. Contact your loan officer for a personalized quote.
Bottom Line
The week was a wild ride of conflicting forces. Wednesday's CPI was fiery hot (0.6% headline, 3.7% YoY, core 2.6%), and Thursday's PPI was even hotter (1.3% headline, double estimates). MBS got pummeled 60 bps and the 10-year surged to 5.31. But a flight to safety from AI hyperscaler debt concerns (CoreWeave, Nebius) sparked a remarkable rally, with MBS surging 35-41 bps and the 10-year dropping toward 5.04. The Economist's 'Will bonds blow up?' cover served as a contrarian indicator. Fed Chair Warsh kept his cards close, dropping October hike odds to ~15%. The Move Index surged above 102, signaling elevated volatility. TIC data confirmed Japan sold $36B and China sold $27B of U.S. Treasuries in August. The 10-year is now testing the 5% level, and MBS is battling the 25-day moving average but unable to sustain breakouts. Next week is light on news (housing starts/permits Tuesday, pending home sales Wednesday), so technicals and stock market movements will drive trading. We are cautiously floating, watching whether the 10-year holds under 5.29 and MBS can break above the 25-day MA.